| Description | Download | Downloads | File Size | Rating | Name | Last Modified | Rating | |
|---|---|---|---|---|---|---|---|---|
| Description | Download | Downloads | File Size | Rating | Name | Last Modified | Rating | |
| Amibroker AFL | ||||||||
| Download | 861 downloads | bytes | 07-01-2020 23:46 | |||||
| Download | 759 downloads | bytes | 07-01-2020 23:46 | |||||
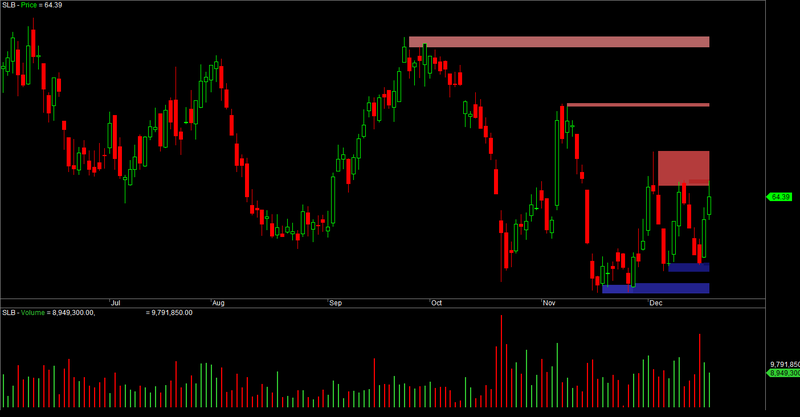
This indicator can find the Supply and Demand zone to make decide entry or exit positions. Work fine with weekly & monthly chart.
A supply zone on a chart is an area where selling interest outnumbers buying interest and the price falls until the buying-selling balance is restored. Similarly, a demand zone is a price level where price rallies because there is much more buying interest than selling interest.
Supply and demand zones can be used as additional entry information, but many traders use them to determine potential targets and exits on their trades. Once you start paying attention to supply and demand zones, you will see that they often act as price magnets where the price often gravitates towards.
Have a good trade!
| Download | 2115 downloads | bytes | 13-03-2018 0:18 | ||||
|
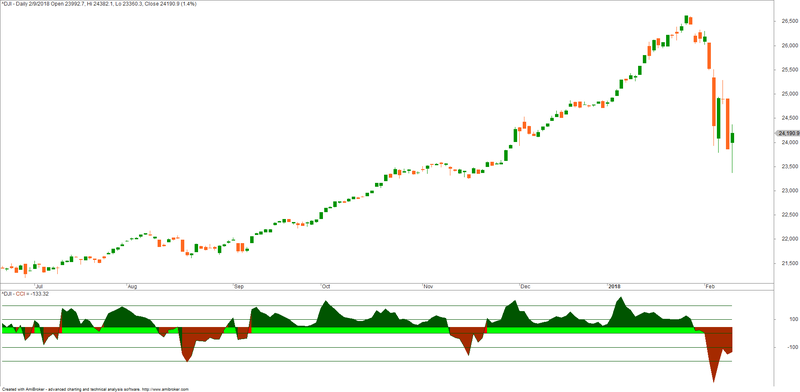
Multi-level of CCI Oscillator to indicate market movements, Overbought and Oversold Oscillator can be combined with Buy and Sell stop
| Download | 1046 downloads | bytes | 13-03-2018 0:11 | ||||
|
Features 1)Buy, Short and Exit Signals Add Supertrend and Moving Average 200EMA over the candlestick and for trading system rules follow the below mentioned rules. Trading Rules Buy – if suptrend shows a buy signal and candle above 200 EMA (Green Arrow) Short – if suptrend shows a sell signal and candle below 200 EMA (Red Arrow) Trailing Stops : Green lines are trailing stop lines for Buy Signal and Red lines are trailing stop lines for Sell Signal. The Default parameter here is ATR of 8 and 4 as Factor...i use a 14 ATR with 3 as factor,,for better result buy above the high of the signal candle and Sell below the Low of the signal candle with a buffer of 0.1%. Credits Goes to our member raj1206 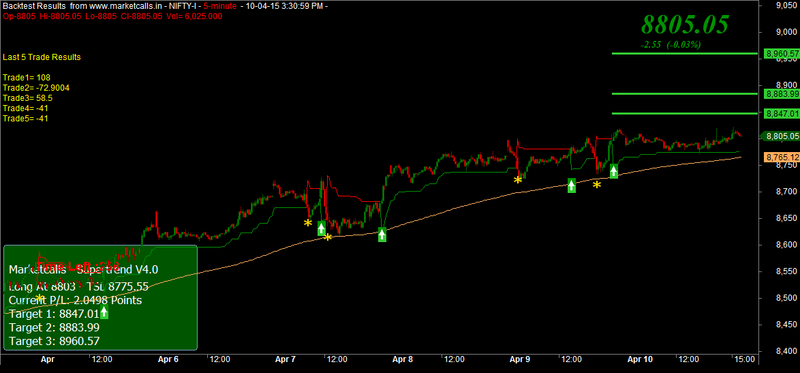 | Download | 1581 downloads | bytes | 19-12-2017 21:16 | ||||
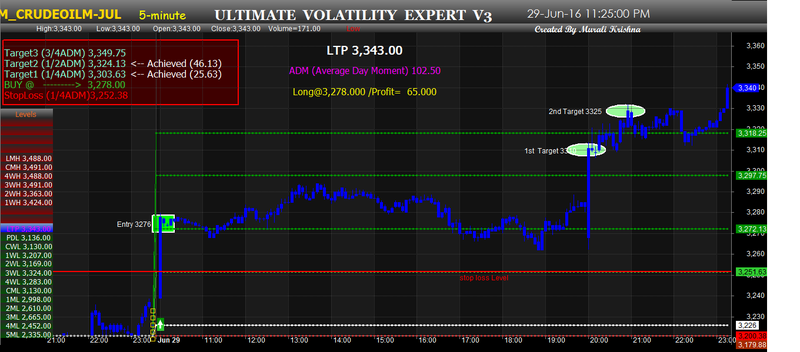
Hi Friends,
This is ULTIMATE VOLATILITY TRADING SYSTEM’s upgrade version. including More Features. Like everyday fresh signals and Target Stop loss levels dash board etc.In this system full focused for Intraday Trading.
Trade Idea: *Entry with Buy Sell Signals.
| Download | 1528 downloads | bytes | 17-12-2017 0:51 | ||||
|
Dear Member, Please use this AFL for intraday ONLY. use in 15 min time frame. Buy signal – you will get automated buy signal, however the catch is you will buy only when you get above blue line Sell signal – you will get automated sell signal, you will sell only when you get below blue line Let me know your thoughts 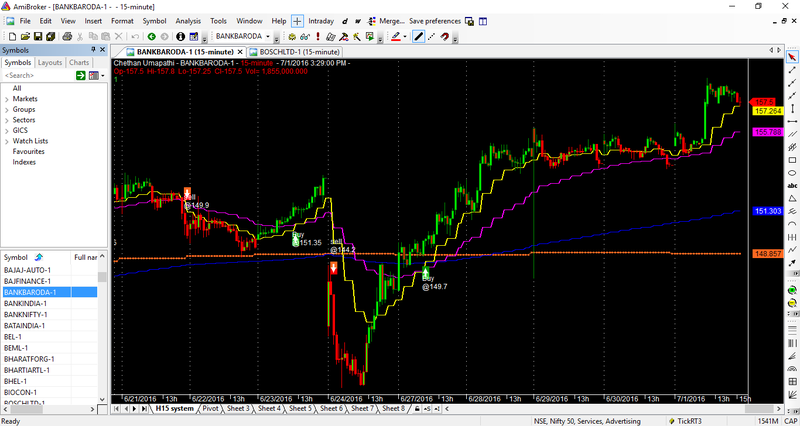 | Download | 1424 downloads | bytes | 17-12-2017 0:38 | ||||
| Download | 1120 downloads | bytes | 17-12-2017 0:33 | ||||
This is a compilation of some afls i got from here and created a hybrid for personal use.
After all the afls I searched and tried, I came to a point that keeping it smart and simple makes my trading stress free.
Thank you to all contributors! All the recognition are yours!
PS The green(5) and red(3) were just my substitution for up/down arrow 🙂
 | Download | 1195 downloads | bytes | 17-12-2017 0:30 | ||||
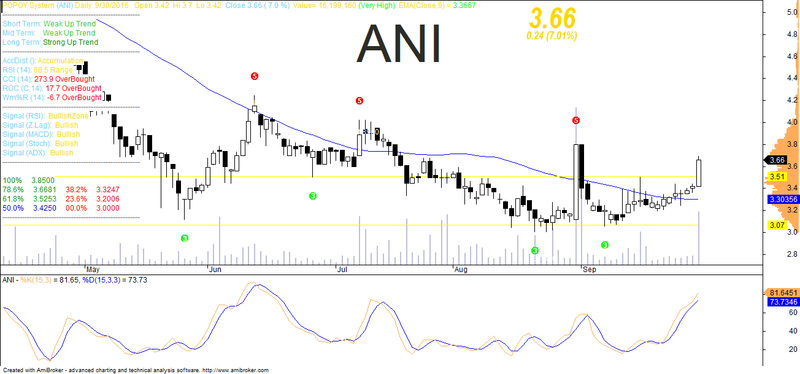
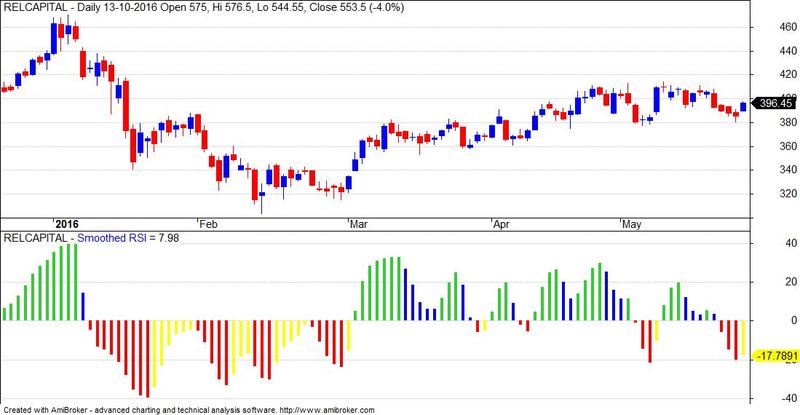
Just like any other indicator it has whipsaws but responsive and smooth compared to the traditional RSI where the noise factor reduces and helps you to focus on mean reversion trades.
The Color Transition from Red to Yellow indicates possible mean reversion from negative to positive trend
The Color Transition from Green to Blue indicates possible mean reversion from positive to negative trend
The Color Transition from Yellow to Green indicates possible positive trend continuation.
The Color Transition from Green to Blue indicates possible negative trend continuation.
Indicator suits to understand the underlying sentiment on the higher timeframes like 4h, Daily. Helps you to understand the underlying trend setup during your pre-trade analysis.
 | Download | 1014 downloads | bytes | 17-12-2017 0:26 | ||||
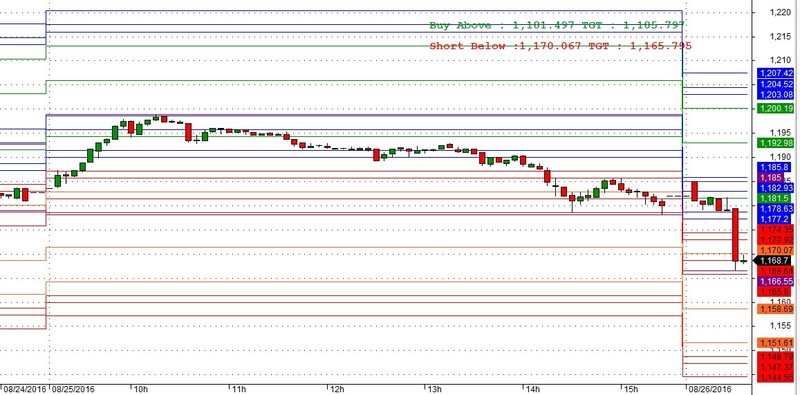
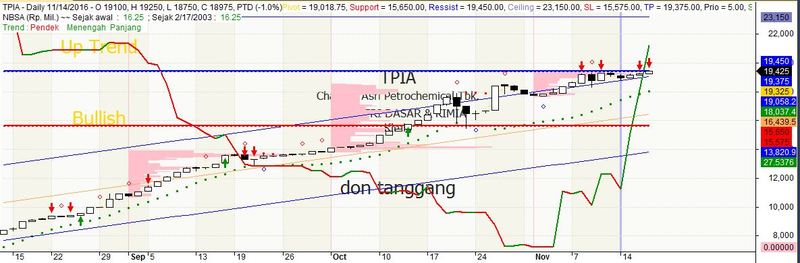
An afl developed by myself, support and resistance are built from fibonacci level over the year, confirm buy and sell signal by using available data on the explorer.
The explorer will give you a lot of data.
Not for backtesting since it uses future reference, excellent to be used for day/position trader.
AFL using Indonesia stock rules for lot and capital determination, can be modified accordingly on the formula
 | Download | 1004 downloads | bytes | 17-12-2017 0:22 | ||||
| VPA 4.0 new version from Karthikmarar | Download | 1066 downloads | bytes | 17-12-2017 0:20 | ||||
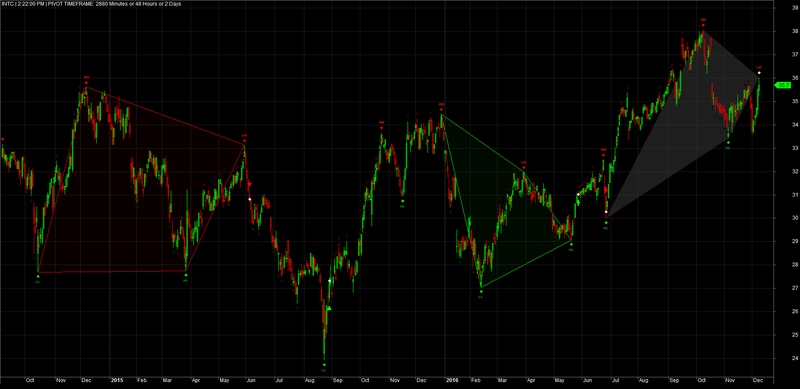
posted similar code already but this code uses the Reverse() function to calculate the ATR pivots. Pivots can for instance be used to look for price patterns. In this case the code looks for “convergence” patterns. By default (see parameter window) it only shows bullish patterns. Once the pattern is confirmed (meaning it will not repaint) the color changes to green (bullish) or red (bearish). As soon as a pattern is confirmed a buy or a short signal will also appear in the chart.
In the example chart you see 3 patterns in the daily INTC chart. The last pattern is bearish but is still not completed and therefor still has a grayish color. The pattern could either be confirmed or disappear before it is confirmed.
 | Download | 1150 downloads | bytes | 17-12-2017 0:01 | ||||
|
/* HARMONIC PATTERN DETECTION using ATR type Peaks and Troughs Automatic Detection of Harmonic Patterns – Gartley, Bat, Butterfly and Crab. Original code by joy.edakad@gmail.com, see: http://www.inditraders.com/amibroker/1934-afl-harmonic-patterns.html file: Harmonic1.1.afl (2009) Modernized by E.M.Pottasch (Dec 2016). - Using ATR based pivots instead of fractal based - Improved visualisation of the patterns. - Nomenclature of variables, constants and arrays, adjusted following code from David Keleher. - uncompleted pivots given white color - multiple issues of the original code corrected for The original code was based on “fractal type pivots”, this code uses “ATR type pivots”. This code also includes a time frame factor. To fully understand how to interpret a pattern use the Amibroker playback utility and see how the patterns develop. */ 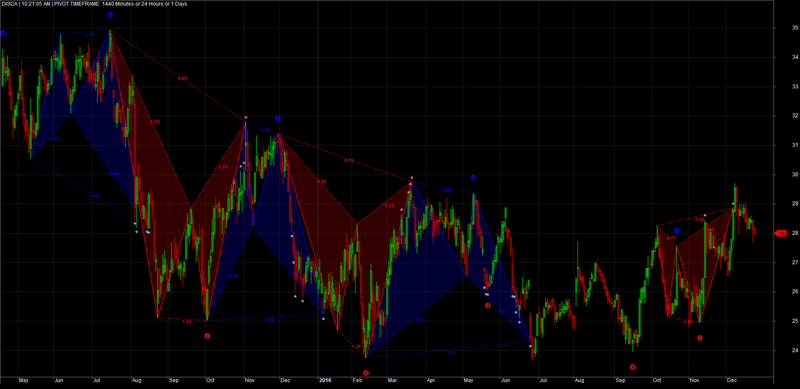 | Download | 1062 downloads | bytes | 16-12-2017 23:58 | ||||
 South wind Afl for Amibroker v6 Download link to files South wind Afl for Amibroker v6 http://www.mediafire.com/download/6aqaizlzgc5w2mu/Foundation-Int.rar 2) Download & install Winzip165 for exctracting .rar file 3) Extract the Foundation-Int.rar and save it in your local hard drive To Install this indicator 2)Copy JurikLib.dll and kpami.dll and paste it in your Amibroker Plugin folder which is by default C:\Program Files\AmiBroker\Plugins 3)Copy T3_include.afl to the AFL formula-include folder which is by default C:\Program Files\AmiBroker\Formulas\Include 4)Copy Foundation by South Wind AFL code Ver 13.afl and paste it in AFL formula-custom folder C:\Program Files\AmiBroker\Formulas\Custom 5)Now to view the charts Open Amibroker and goto File→New→New Chart 6)then goto View→Charts and select the afl from the left plane under the Custom folder 7)Then set the background to black. To do so goto Tools→Preference and select the color tab and set the background color to
| Download | 1349 downloads | bytes | 16-12-2017 23:50 | ||||
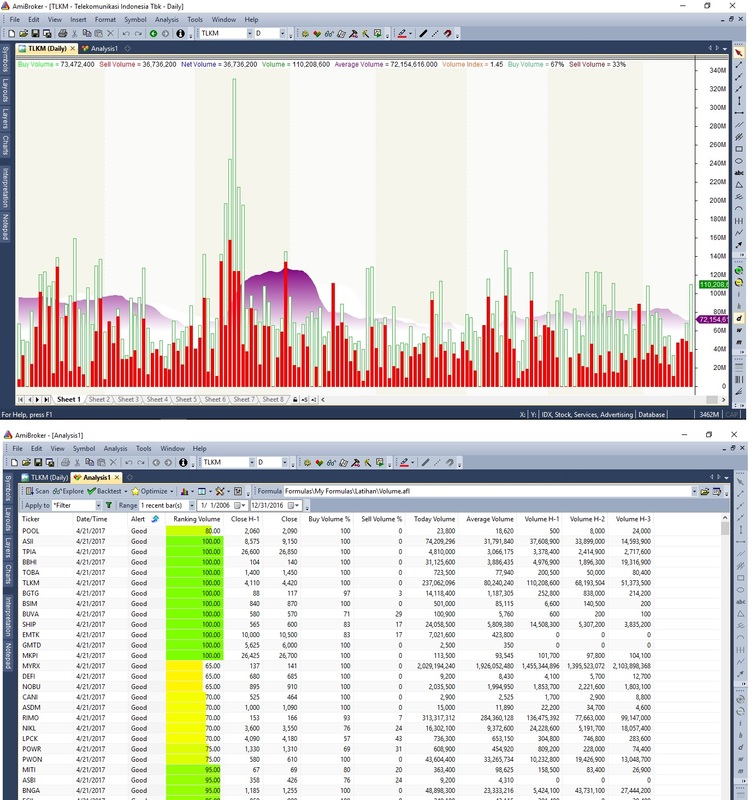
ATURAN MAIN
// Volume Naik, Harga Naik = Buy|Positive|Bullish
// Volume Naik, Harga Turun = Sell and Cutloss|Negative|Bearish
// Volume Turun, Harga Turun = Buy on Weakness|Positive|Bullish
// Volume Turun, Harga Naik = Sell on Strong|Negative|Bearish
 | Download | 1061 downloads | bytes | 16-12-2017 23:47 | ||||
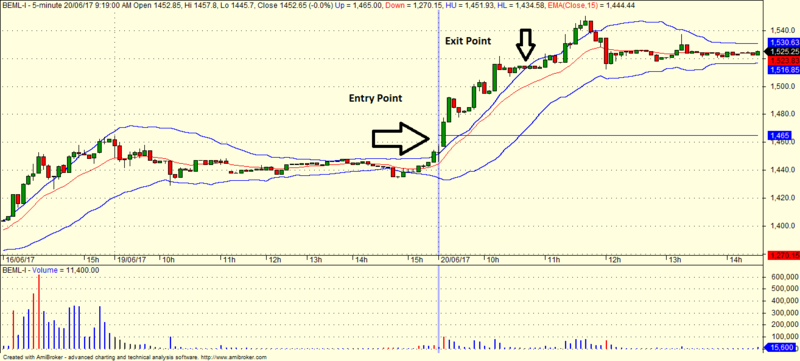
This is a Day trading system.
Explore the AFL in daily time frame and watch it in 5 min Chart.
if Stock breaking out is above or below Blue band than enter the trade and exit if close below EMA line or price enters again in Band according to your risk profile.
 | Download | 1629 downloads | bytes | 16-12-2017 23:41 | ||||
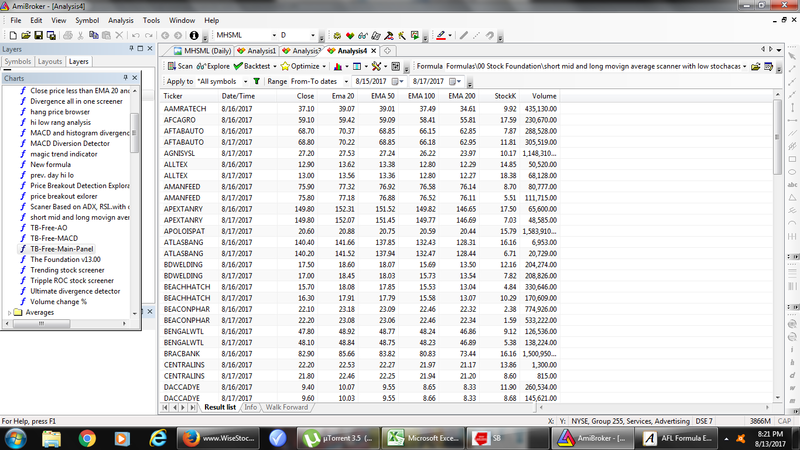
This formula looks for a stock that ;is trending; which means that;
– close price is greater than short term moving average;
– short term moving average is greater than long term moving average. and
the stock a a low stochastic value – which means that the stock is oversold.
 | Download | 914 downloads | bytes | 16-12-2017 23:37 | ||||
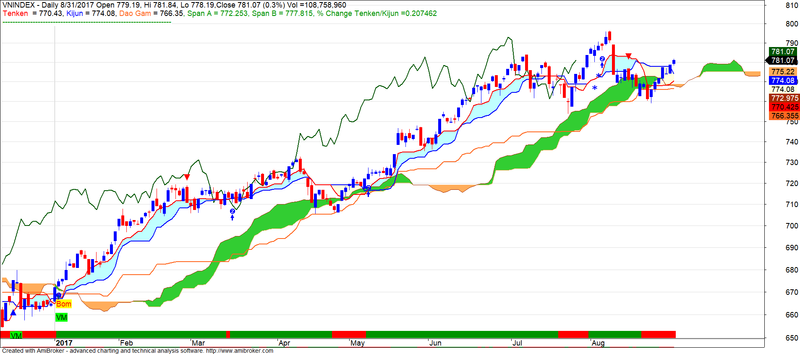
This is the best ichimoku formula I've been developing for Vietnam Stock Market
 | Download | 1278 downloads | bytes | 16-12-2017 23:33 | ||||
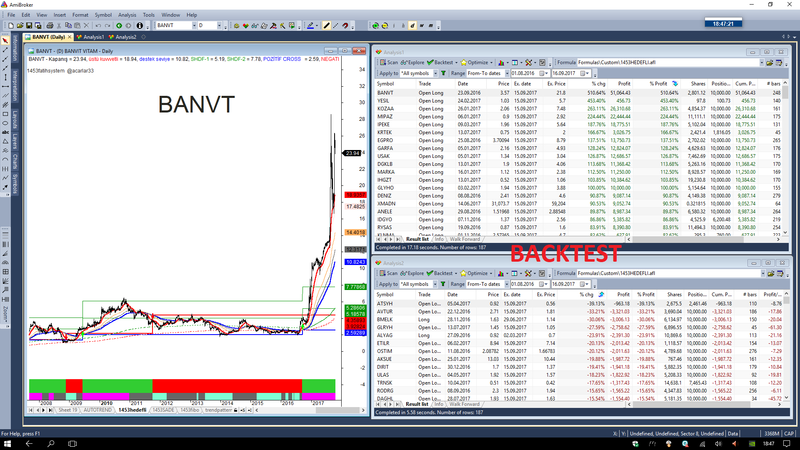
It is a system for long term Buying. It is Affect on Affiliates.
It provides a return of 100% – 500% between 6 months and 2 years.
 | Download | 1076 downloads | bytes | 16-12-2017 19:20 | ||||
I found this formula in one of the forum.
Thanks to the original Author
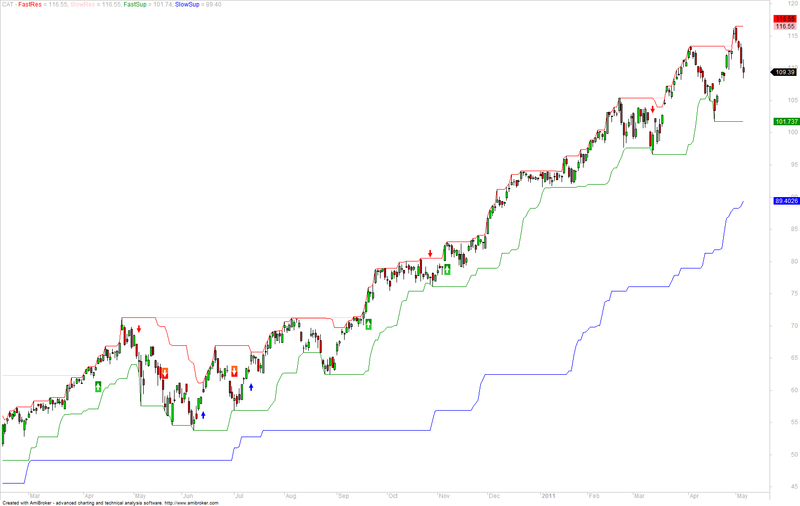
This indicator plots the dynamic support both a short term and long term support and resistance. It also has trading system rules to buy when the following conditions are met:
 | Download | 956 downloads | bytes | 16-12-2017 19:12 | ||||
This great code was created by Panos on the amibroker forums. It allows you to plot fib retracements at 12.5% increments. To use it you need to draw a trendline from the high point where you want the fib retracements to start to a low point. Next you need to select the trendline and go to properties and set the ‘Study ID’ to ‘P1’. Once done you should see the fib retracements plotted. You can check out the full forum post here
 | Download | 1087 downloads | bytes | 16-12-2017 19:06 | ||||
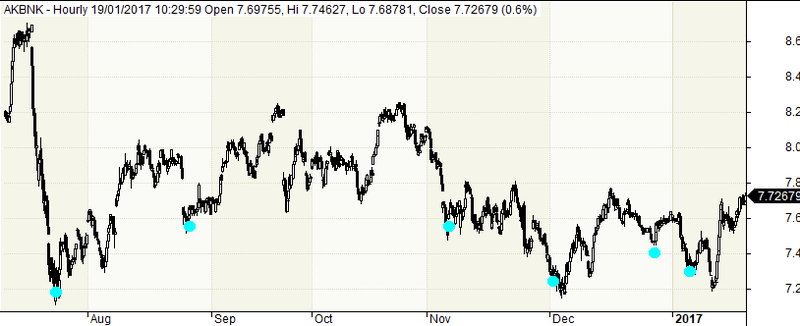
You can use in all time frames. But on hourly charts gives best results. Try to pick bottom points based on the following conditions:
| Download | 946 downloads | bytes | 16-12-2017 18:04 | ||||
|
This indicator was created by Karthik Marar. It is based on the True Strength Index (TSI) indicator and has two versions. The first version uses exponential moving averages as is called for in the original TSI formula and a modified version, which uses adaptive moving averages instead of simple exponential moving averages. The two versions can be selected via the parameters. The various conditions, like entry and exit are determined using the ‘Ravi’ indicator and the ‘Linear Regression Slope’. Some Information about what is displayed by the indicator:
To find out what the various numbers mean and under what conditions they appear see the code. 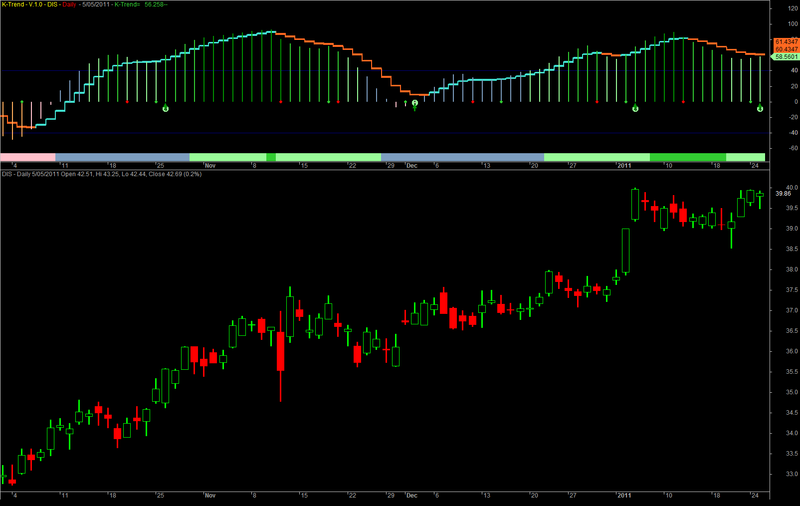 | Login | 23 downloads | bytes | 16-12-2017 17:49 | ||||
|
Volume based intraday trading strategy, suitable for algo traders. Buy and Sell conditions are based on previous day Volume. Trigger price, start Time, end time, stop loss and target has been added. 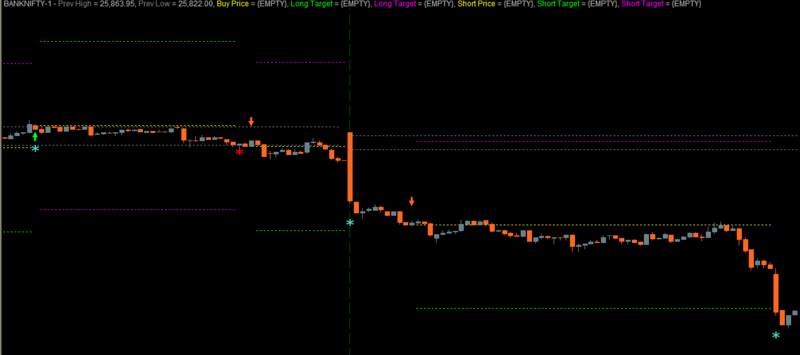 | Login | 41 downloads | bytes | 16-12-2017 15:35 | ||||
Made4Trades
Indian Stock Market Chat Room,Forum – Live Stock price ticker rates, Nifty Heat Map, Live Nifty Stock Chart, Stock Calls